

MT5EA
EAダウンロードjpでは、優秀なEA、スキャルピングEA、仮想通貨用EAなどMT5の自動売買プログラム(EA)を無制限かつ無料でダウンロードできます。ダウンロードリンクは下記より
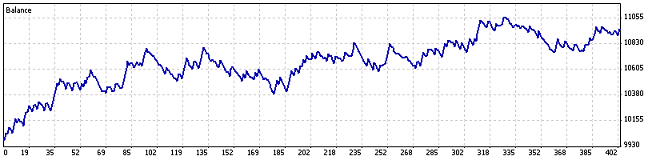
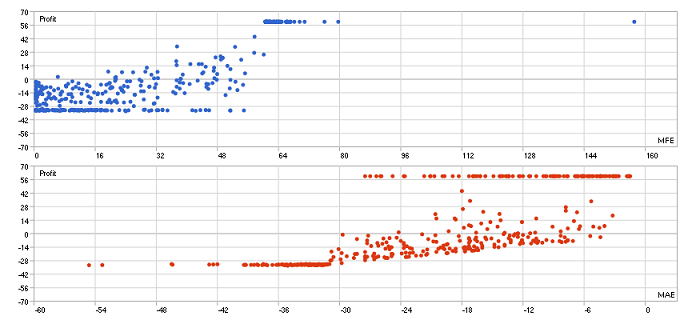
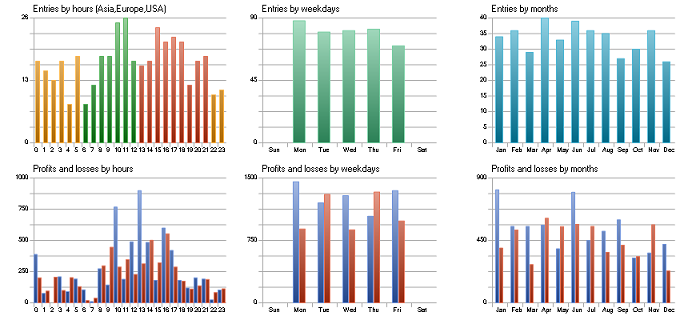
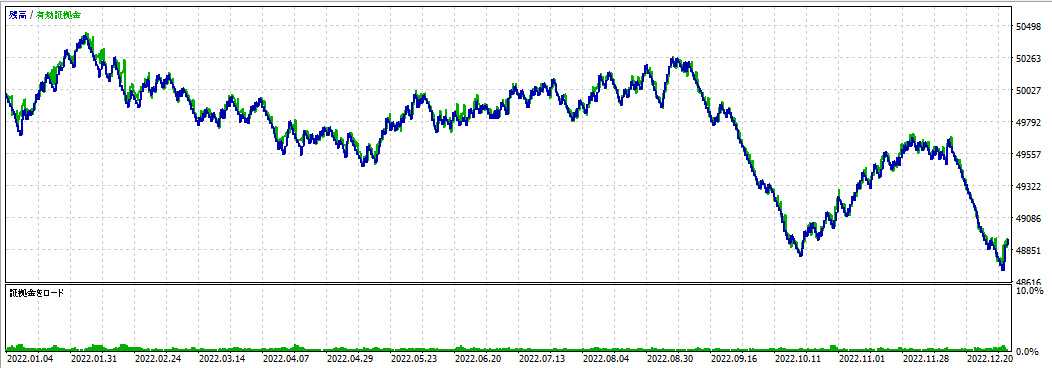
MT5-EAダウンロード: MACDWaterラインクロス
MT5 EA
MT5EAダウンロードjpでは、高品質かつ効果的な多数の自動売買システム(EA)を無料で提供しています。
また、多くのEAは、さまざまな通貨ペアに対応しています。無料EAを使用して、よりスマートなトレードを始めましょう。
MT5EAダウンロードjpのEAは、一般的なテクニカル指標をはじめ、複雑なアルゴリズムを使用したものまで幅広いバリエーションがあります。
完全無料でダウンロードが可能です。初心者の方でも安心して利用でき、EAの種類も多く、自分に合ったEAを見つけることができます。
注意事項
・すべてのEAは無料でご利用できます。
・バックテストに制限はありません。
・バックテスト結果の画像は成績を保証するものではありません。
・予約注文を指定するEAの場合、ストップレベル(最小指値幅)が広い一部の業者では稼働しない可能性があります。
・業者のサーバータイムゾーンによってEAの稼働結果が変わることがあります。
・ライブ口座で稼働させる前にバックテストやデモ口座などで十分に検証してください。
・予告なくEAの掲載を終了することがあります。
・まれに制限がかかっていないEAがありますが、その場合はそのまま利用していただいて結構です。
・ライブ口座でこのEAを使用したことによる損失については当サイトは責任を負いません。
・一部の業者ではスキャルピングや両建てや頻繁なオーダーの修正が禁止されている場合があります。
・ソースコードをご希望の場合は商品ページURLとご予算を添えてお問い合わせください。
・フィリングモードが異なるアカウント(FOK,IOC)では稼働しない場合があります。
・マージンモードが異なるアカウント(ヘッジ,ネット)では稼働しない場合があります。
本サイトは、日本居住者にFX取引を勧誘することを意図したものではありません。
高リスクについての警告: 外国為替取引はすべての投資家に適しているわけではない高水準のリスクを伴います。
レバレッジは一層大きなリスクと損失の可能性を生み出します。外国為替取引を決定する前に、投資目的、経験の程度およびリスクの許容範囲を慎重に考慮してください。
当初投資の一部または全部を失うことがあります。したがって損失に耐えられない資金投資をしてはなりません。外国為替取引に関連するリスクを検討し、疑義があるときは中立的な財務または税務アドバイザーに助言を求めてください。
またサイトに掲載中のシステムは稼働を100%保証するものではありません。ご利用に際しては十分な確認、検証を行うものとし、システムの利用によって発生した損害、損失は免責とさせていただきます。
Originally posted 2019-08-27 18:47:10.
MT5 EA
MT5-EAパスワード申請
Originally posted 2019-08-27 18:47:10.
EAのデコンパイルについて
EA(Expert Advisor)は、MetaTraderプラットフォームで使用される自動売買プログラムです。EAをデコンパイルすることは、元のコードを取得するためにバイナリコードを逆アセンブルして読み解くことを指します。EAのデコンパイルは、EAを作成した人がEAのソースコードを公開していない場合に有用です。
EAをデコンパイルするには、専用のツールが必要です。多くのツールが存在しますが、一般的に使用されるのは「EX4-TO-MQ4」などのデコンパイラです。これらのツールを使用することで、バイナリコードを元のMQL4ソースコードに変換することができます。
ただし、EAのデコンパイルは法的に許可されていない場合があります。EAの著作権は作成者に帰属しているため、彼らがデコンパイルに反対している場合は違法行為になります。EAをデコンパイルする前に、著作権法に関する法律を確認することが重要です。
また、デコンパイルしたEAを修正して再配布することは法的に許可されていません。再配布する場合は、元の作成者から許可を得る必要があります。
EAのデコンパイルは、EAの改善や学習目的でのみ使用することが推奨されます。違法行為にならないように、著作権法に関する法律を遵守することが重要です。
MT5のEAのデコンパイルについて
MT5(MetaTrader 5)は、MetaQuotes社が開発した取引プラットフォームで、EA(Expert Advisor)と呼ばれる自動売買プログラムを使用することができます。MT5のEAをデコンパイルすることは、バイナリコードを逆アセンブルして元のソースコードを取得することを指します。
MT5のEAをデコンパイルするためには、専用のデコンパイラソフトウェアが必要です。MT4とは異なり、MT5のEAのバイナリコードは保護されており、デコンパイルが困難になっています。しかし、デコンパイルを行うためには、いくつかのツールが利用可能です。
現在、MT5のEAのデコンパイルに関する最も一般的な方法は、「EX5-TO-MQ5」デコンパイラを使用することです。このツールは、バイナリコードを元のMQL5ソースコードに変換することができます。ただし、MT5のEAのデコンパイルは、法的には問題があります。MT5のEAの著作権は作成者に帰属しており、彼らがデコンパイルに反対している場合は違法行為になります。
MT5のEAをデコンパイルする際には、著作権法に関する法律を遵守することが重要です。デコンパイルは、EAの改善や学習目的でのみ使用することが推奨されます。また、デコンパイルしたEAを修正して再配布することは法的に許可されていません。再配布する場合は、元の作成者から許可を得る必要があります。
最近、MT5はより高度なセキュリティ対策を導入し、EAのデコンパイルを困難にすることがあります。したがって、MT5のEAのデコンパイルは、MT4のEAのデコンパイルよりも困難であることに留意する必要があります。
「EX5-TO-MQ5」は、MetaTrader 5(MT5)のEA(Expert Advisor)のデコンパイルに使用されるツールの1つです。このツールは、バイナリコードを逆アセンブルして元のソースコードを取得することができます。
EX5-TO-MQ5は、MT5のEAのバイナリコードを解析するために特別に設計されたプログラムであり、EAのデコンパイルに必要なすべてのツールを提供します。ツールは、MT5のバイナリファイルを解析し、バイナリコードを逆アセンブルして、元のMQL5ソースコードに変換します。
EX5-TO-MQ5は、デコンパイルが可能なバイナリコードの種類を拡張するために、定期的にアップデートされています。また、ツールには多数のオプションが用意されており、デコンパイルに関する様々な設定が可能です。
ただし、EAのデコンパイルは、MT5の利用規約に反する可能性があるため、法的な問題が発生することがあります。EX5-TO-MQ5を使用してEAをデコンパイルする前に、著作権法に関する法律を確認し、EAの作成者がデコンパイルに同意しているかどうかを確認する必要があります。
EAのデコンパイルは、EAの改善や学習目的でのみ使用することが推奨されます。再配布する場合は、元の作成者から許可を得る必要があります。また、MT5はより高度なセキュリティ対策を導入しており、EAのデコンパイルが困難になっていることに留意する必要があります。
Originally posted 2019-08-27 18:47:10.
Originally posted 2019-08-27 18:47:10.